Sowing seeds of prosperity since 1936
Transforming with trust: We are Orient Paper
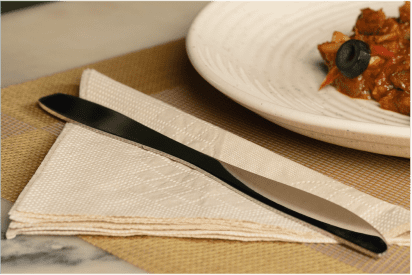
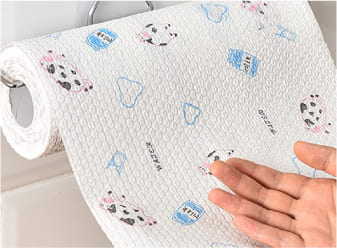
Wellness & Hygiene
Writing & Printing


Harvesting responsibly for sustainability
Transforming with trust: We are Orient Paper
50,000 acres of land treatment
102,000 acres of agro forestry
90,000 households


Nurturing dreams for generations
Transforming with trust: We are Orient Paper
Indian
Subcontinent
Middle East
Africa
US
Europe


Putting purpose first… people, planet, progress
Transforming with trust: We are Orient Paper
1089
villages
1000+
SHGs
90,000
smallholders
0.4 million
acres under restoration
About Us
Making paper…with purpose
An Indian company with a legacy of leadership in making high-quality paper sustainably, Orient Paper has been an integral part of the everyday lives of millions since 1936.
85+
years
15+
countries
2000+
employees
100,000+
tonnes of paper capacity
170,000+
hectares of forest land
Products & solutions
Not just products, but sustainable solutions
Wellness & Hygiene
Orient Paper is the first Indian brand to make high-quality virgin tissue paper for hygiene and wellness applications.
Read more
Orient Tissue Paper
Orient Natura

Orient Bamboo Natura
Writing & Printing
Orient Paper’s high-bulk writing and printing solutions are made exclusively from responsibly sourced virgin pulp.
Read more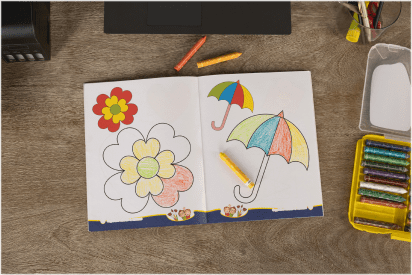
Orient Platinum

Orient Peacock

Orient GreenPlanet
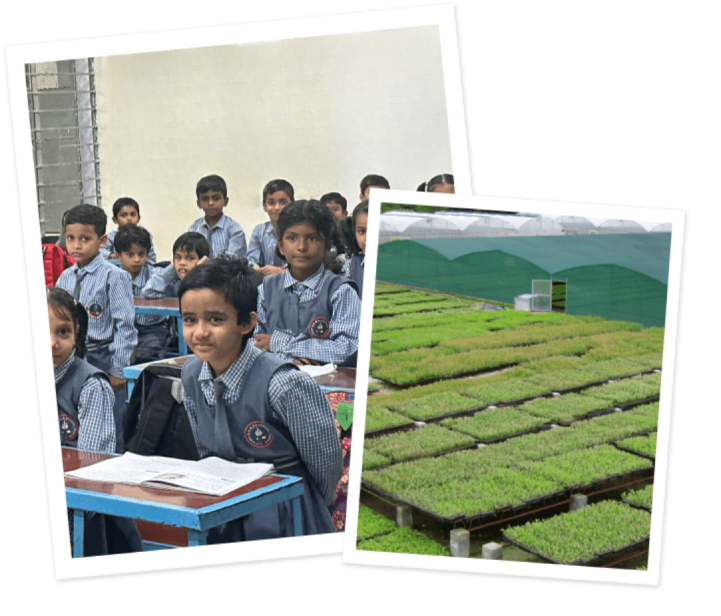
Our communities
Care, compassion & commitment

450,000+
livelihoods
90,000+
smallholder families
75%
tribal households
1089+
villages
1000+
SHGs
45%+
students educated are girls
Sustainability
Turning a new leaf, sustainability in action
350,000+
saplings planted
150,000+
saplings grown in-house
0.4 million
acres under reforestation
Paperpedia
Insights to inspire, on every paper
Blogs


Success Stories
News


Our people
A purposeful career, crafted on paper
Inclusive. Impactful. Innovative.